Dove acquistare
Hai bisogno di consigli? I nostri rivenditori altamente preparati saranno felici di aiutarti.
Trova un rivenditore nelle vicinanze
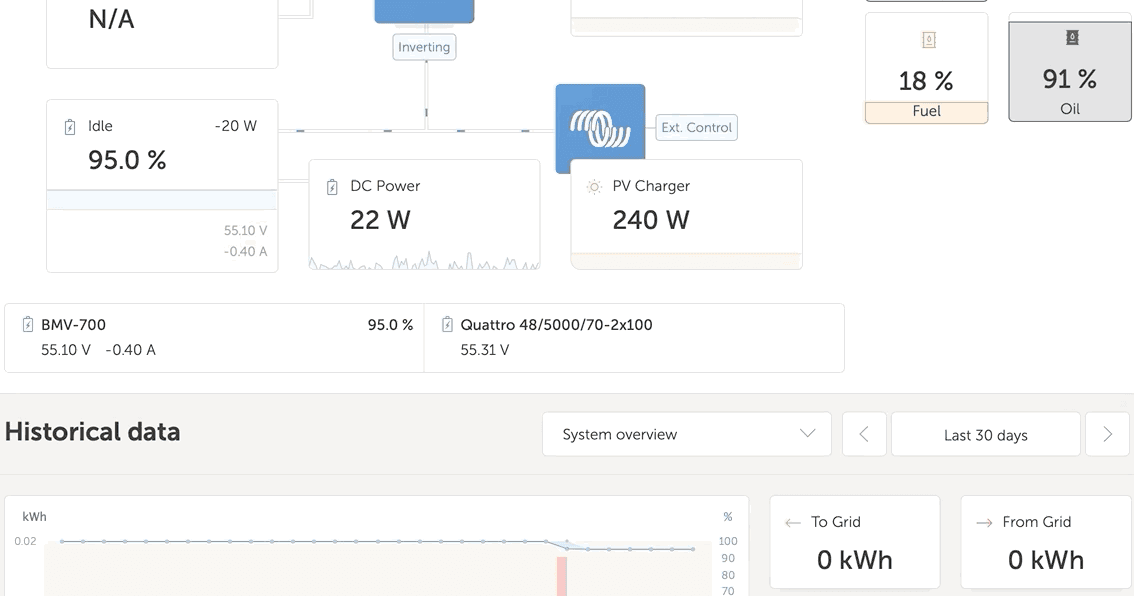
The dashboard for the Victron Remote Management portal has been completely re-imagined.
Combining a diagrammatic presentation of the installation with historic information it now presents the data in real time, updated every two seconds.
The goal was to produce complete at-a-glance status information for every kind of installation, on a single page.
The schematic style is familiar to us from ‘GX’ device displays. The example above is from an installation on board a boat and includes four tank levels – provided both as a percentage, and intuitively ‘shaded’ levels. More detailed datasets are presented when the cursor is hovered over graphical presentation.
Real time data requires two-way communication between VRM and the Installation. The new dashboard increases the GX CPU load. Data usage is also increased. Both CPU load and extra data usage are only increased while the dashboard is being observed. To mitigate the extra loading, live data communication will automatically be suspended if the GX CPU load becomes too high; then the data will be refreshed as per the interval configured on the GX Device.
When live data has been suspended a warning will appear:
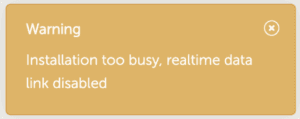
If the VRM portal is left open in a tab which is not in focus on your device, live reporting will be suspended after one minute.
For more details, see the manual.
More information can be found in our new VRM Dashboard introduction video.
Hai bisogno di consigli? I nostri rivenditori altamente preparati saranno felici di aiutarti.
Trova un rivenditore nelle vicinanze
Consulta il nostro database o contatta il tuo rivenditore per avere supporto tecnico dedicato, richieste di riparazioni o di garanzia.
Assistenza
Leggi di più sulla nostra garanzia standard di 5 anni leader del settore e sul servizio di riparazione globale.
Garanzia

©Victron Energy 2026